National Retail Federation Chief Economist Jack Kleinhenz discusses consumer confidence, retail sales during the holidays and inflation. He speaks with Vonnie Quinn and Oliver Renick on “Bloomberg Markets.” (Source: Bloomberg)
Economic Reviews
ACE Report: Service sector sparks October jobs gain

The region reversed two months of job declines in October, adding 2,498 jobs, according to the Ahola Crain’s Employment (ACE) Report.
Seasonally adjusted, the region saw employment rise to 1,171,849 from 1,169,351 a month earlier, a 0.2% increase.
While the service-producing sector shows a year-over-year gain of 5,407 jobs, the goods-producing sector declined by 2,181 jobs. Smoothing out the month-to-month figures, on a year-over-year basis, the seven-county workforce increased 3,226 jobs, a gain of 0.3%, since October 2015.
The regional decline in the goods-producing sector echoes the national pattern. The United States lost 9,000 manufacturing jobs in October, according to the Bureau of Labor Statistics.
“Service employment has been growing, but manufacturing payrolls are either sluggish or declining,” reported Jack Kleinhenz, the Cleveland Heights economist who created the ACE model. “The factory sector continues to face stiff headwinds, including weak global demand due to sluggish growth abroad, a strong dollar and low commodity prices.
Longer term, employment in the goods-producing sector peaked in July 1979 at 25,163,000. Since then, sector employment has declined by 5,548,000 — or 22% — to its current level of 19,615,000. Those jobs have been lost largely to automation and shop-floor tracking systems that increase efficiency and, to a lesser degree, to globalization.
A bright spot at the national level, Kleinhenz said, is the 0.4% gain in average hourly earnings, up 2.8% over the past year.
Economists at Pittsburgh-based PNC Financial Services Group called that growth in average hourly earnings the fastest increase in seven years.
“As the job market gets tighter, firms are responding to tougher competition for workers by raising pay,” the financial services firm said in its Nov. 4 economic report. “This is very good news for incomes and consumer spending.”
The Federal Reserve Board’s most recent Beige Book, which gathers anecdotal information on each region of the country, said of the Cleveland region, “Wage pressures were most evident in the construction and retail sectors across skill levels. Reports from staffing firms about job openings and placements were mixed, though all contacts noted an increase in the number of temporary positions.”
Seaonally adjusted data

| Month | Non-Farm | Small (1-49) | Mid-Sized (50+) | Goods-producing | Service Producing |
|---|---|---|---|---|---|
| Mar-16(actual) | 1,175,919 | 478,541 | 697,378 | 215,829 | 960,090 |
| April (est) | 1,169,858 | 476,032 | 693,826 | 215,323 | 954,536 |
| May (est) | 1,174,111 | 477,748 | 696,363 | 216,312 | 957,799 |
| Jun (est) | 1,172,025 | 476,883 | 695,141 | 216,156 | 955,869 |
| Jul (est) | 1,175,213 | 478,117 | 697,096 | 217,662 | 957,551 |
| Aug (est) | 1,171,067 | 476,593 | 694,474 | 214,553 | 956,515 |
| Sept (est) | 1,169,351 | 475,985 | 693,367 | 212,954 | 956,398 |
| Oct (est) | 1,171,849 | 476,981 | 694,868 | 213,697 | 958,152 |
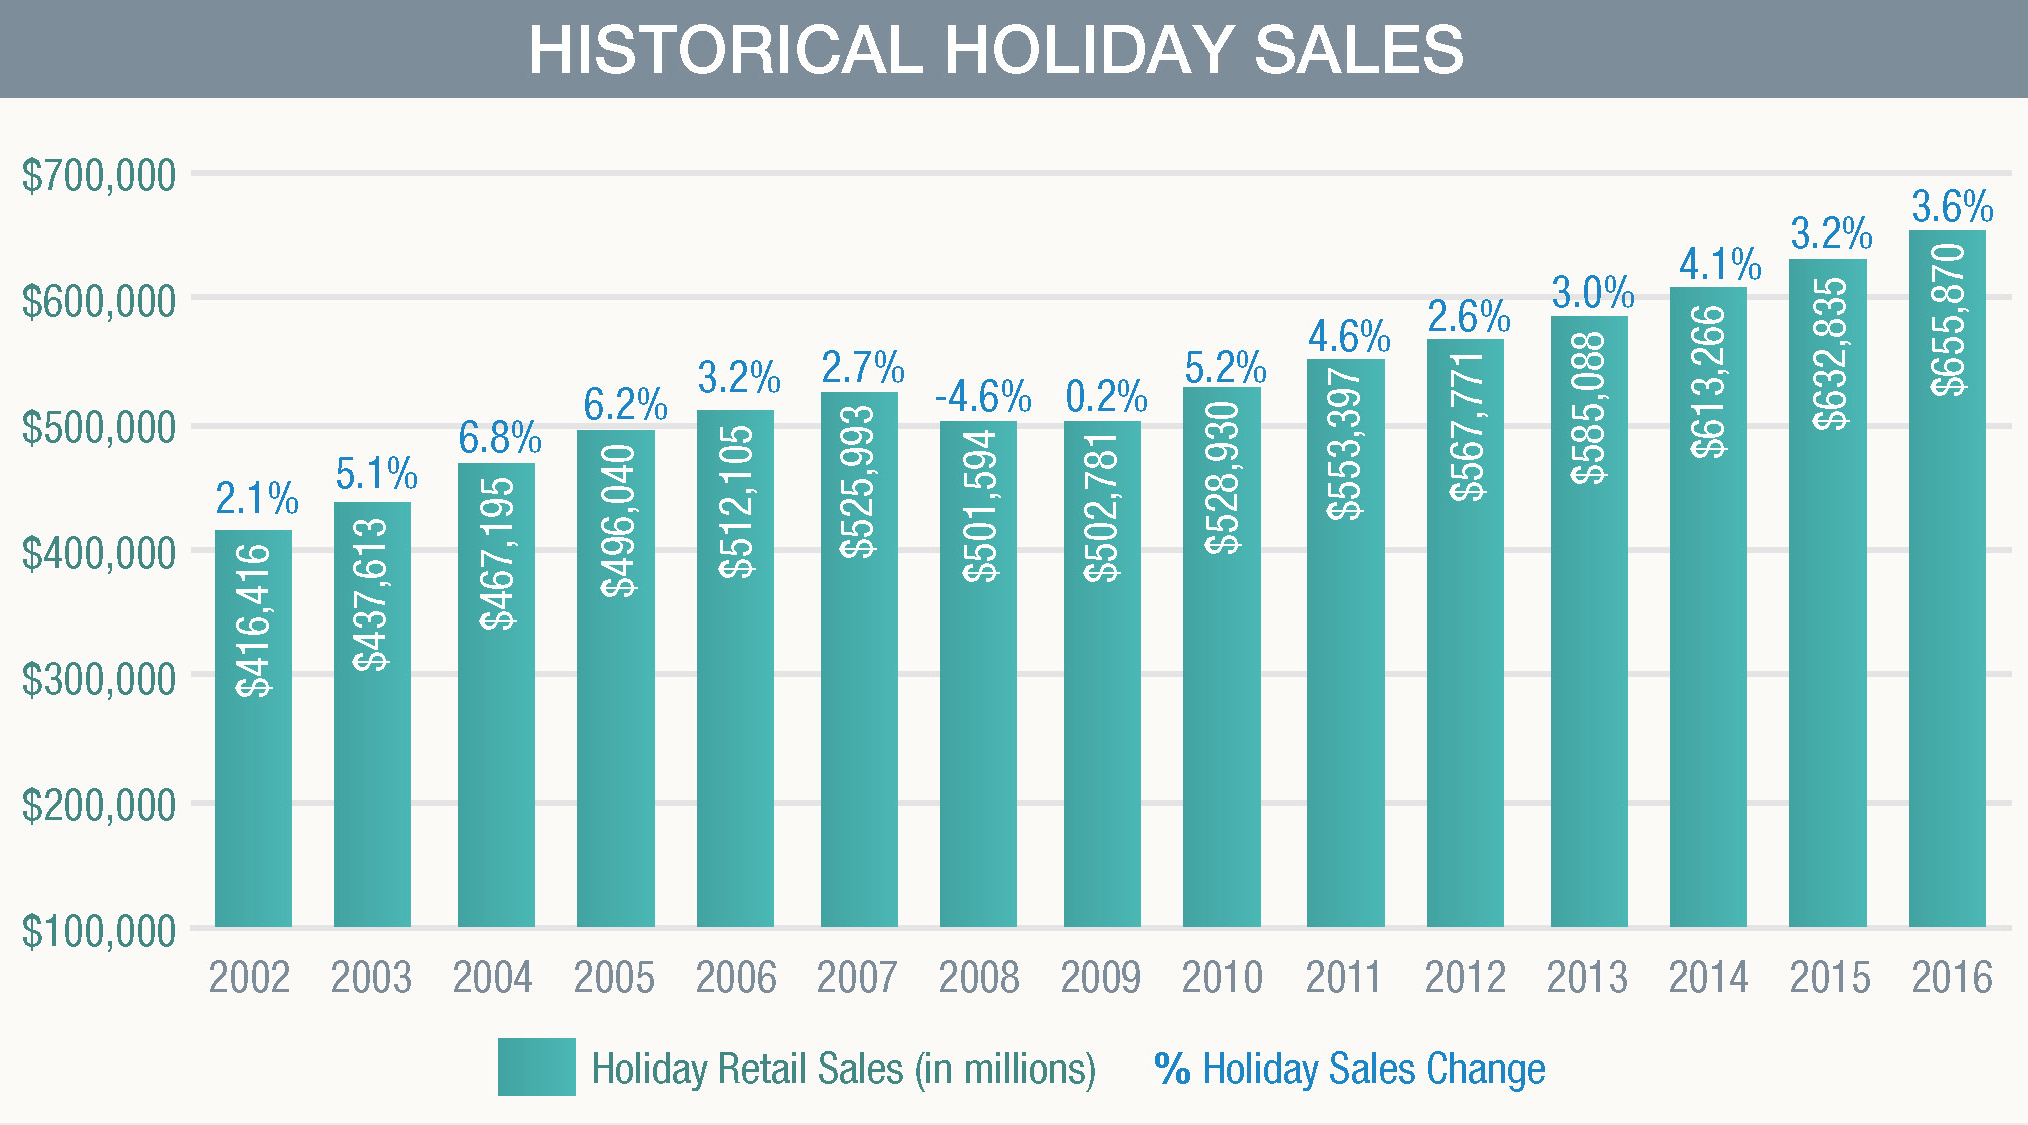
Holiday sales to rise 3.6 percent this winter: NRF
A more confident group of consumers are expected to loosen their purse strings this holiday, and are seen sparking an acceleration in retail sales growth over last year.
The National Retail Federation on Tuesday said it expects retail sales excluding automobiles, gasoline and restaurants to rise 3.6 percent in November and December, to $655.8 billion. That would mark an acceleration over last year’s 3 percent increase, and would easily top the 10-year average of 2.5 percent growth.
The trade organization’s forecast, considered the industry benchmark, is based on an economic model that factors in consumer credit, monthly retail sales and personal income.
NRF anticipates non-store sales, which skew toward digital, will increase between 7 percent and 10 percent, to as much as $117 billion.
“We have a lot more people working this year,” Jack Kleinhenz, NRF’s chief economist, told reporters.
When factoring in other indicators like wage growth and higher home prices, “our general sense of the economy is that we’re in better shape than we were last year,” Kleinhenz said.
Source: NRF
Retailers got off to a rocky start in 2016, as last winter’s unseasonably warm temperatures left their shelves stocked with coats and scarves. Stores were forced to aggressively discount these items to make way for spring goods, cutting into their margins. Retailers have finally gotten their inventory levels in check, boding well for their profitability this season.
Yet even as more Americans are working and receiving slightly higher paychecks, they’ve been reluctant to spend on traditional retail goods — namely apparel. Broad-based discounting has also cut into retailers’ top lines, requiring them to sell more items to record a gain.
And weather once again took a toll on sales in August and September, thanks to a warm back-to-school and early fall selling season. High temperatures dented apparel specialty stores’ revenue by $393 million during those two months as compared with the prior year, according to new research by Planalytics.
More broadly speaking, data from the Commerce Department shows that retail sales in August slipped on a monthly basis for the first time since March.
Despite the slowdown, Planalytics predicts temperatures on the densely populated East Coast will be more in line with typical years this holiday, which should help spur demand for cold-weather categories. And while some holiday purchases may be pushed back because of the election, the trade organization said it does not anticipate political uncertainty to dent sales.
“This year has not been perfect,” NRF President Matthew Shay conceded. “Overall we think this is a realistic number and very reflective of the current environment.”
Like NRF, separate forecasts from Deloitte, AlixPartners, the International Council of Shopping Centers and RetailNext are all calling for growth between 3.2 percent and 4 percent. PwC expects a more robust 10 percent lift in spending; unlike the other predictions, its forecast includes spending on restaurants and travel.
Retail sales excluding automobiles and parts rose 2.8 percent through August, according to the Commerce Department.
Krystina Gustafson | @KrystinaGustafs
CNBC
ACE Report: Despite job losses, other signs suggest economic growth

A projected decline of 2,343 jobs in June ended a five-month string of Northeast Ohio job gains, though the loss may only reflect a summertime blip since other indicators suggest job and economic growth, according to data in the latest Ahola Crain’sEmployment (ACE) Report.
Also, the month-to-month, 0.02%, drop in seasonally adjusted employment for the seven-county Akron-Cleveland region, is balanced against a year-over-year gain of 6,249 jobs, a 0.54% increase from June 2015 to June 2016.
“It’s hard to gauge whether or not the expected pullback in payrolls point to a sea change in regional economic activity,” said Jack Kleinhenz, the Cleveland Heights economist who created the ACE model. “Payroll growth has been choppy. A similar pattern was evident in 2015 as payrolls fell off in the summer but then rebounded in the fall.”
Private-sector employment in the metro area dropped 0.22%, or 2,589 jobs, between June 2015 and July 2015, according to the ACE model, before recovering.
The report projects that service producing firms account for about 2,279 lost jobs, while the goods producing sector shows only a loss of about 64 jobs.
Kleinhenz noted that the stronger dollar “has shown to be a significant speed bump for regional, state and U.S. manufacturing exporters and has created a drag on domestic employment, income and spending.”
He said the research office of the Ohio Development Services Agency estimates that Ohio merchandise exports declined 3%, or $50.7 billion, between 2014 and 2015. But, Kleinhenz reported, other indicators of the economy do point in a positive direction.
“Both the Institute of Supply Management’s manufacturing and non-manufacturing indexes showed a pickup in the pace of growth in June and registered expansionary readings for survey’s employment component,” he said. “This bodes well for area income and spending.”
The U.S. manufacturing sector showed strong growth in June according to the latest monthly survey conducted by the Institute for Supply Management. Manufacturing supply executives indicated a Purchasing Managers’ Index increase of 1.9%
Of the 18 manufacturing sectors tracked by ISM, 13 reported growth in June led by printing, textiles, petroleum and coal products and food, beverage and tobacco products. The three industries reporting contractions are electrical equipment, appliances and components; transportation equipment; and rubber and plastic products.
| Month | Non-Farm | Small (1-49) | Mid-Sized (50+) | Goods-producing | Service Producing |
|---|---|---|---|---|---|
| Dec (actual) | 1,169,198 | 475,677 | 693,522 | 216,446 | 952,753 |
| Jan (est.) | 1,165,378 | 474,177 | 691,201 | 214,962 | 950,416 |
| Feb (est.) | 1,167,066 | 474,922 | 692,143 | 214,430 | 952,635 |
| Mar (est.) | 1,167,163 | 474,950 | 692,213 | 214,622 | 952,541 |
| Apr (est.) | 1,169,020 | 475,698 | 693,323 | 215,075 | 953,945 |
| May (est.) | 1,173,765 | 477,613 | 696,152 | 216,172 | 957,593 |
| June (est) | 1,171,422 | 476,634 | 694,788 | 216,108 | 955,313 |
By JAY MILLER
July 29, 2016
Survey: Families stock up for back to school after tightening belts last year
Families that decided to get another year’s use out of backpacks and laptops during last summer’s back-to-school shopping season are ready to reopen their wallets, according to a National Retail Federation survey released Thursday.
An average family with children in the elementary to high school range will spend about $673.57 on back-to-school items including clothing, electronics and other supplies, up nearly 7 percent from last fall.
Total back-to-school spending is expected to hit $27.3 billion this year. Add in school-related spending by families with college students, and the figure rises to $75.8 billion, up from $68 billion the year before.
Average household back-to-school spending has grown over the past decade, but often rises and falls as families stock up one year, then cut back as they get a second year out of longer-lasting purchases, said Ellen Davis, the retail trade group’s senior vice president of research and strategic initiatives, on a media call discussing the survey results
The $673.57 figure is up from $630.36 last year but only slightly tops the $669.28 the average family planned to spend in 2014, according to the NRF.
“The jeans might be too tight this year and the glue sticks might be dry and it’s time for a new iPad. That means a lot of families are going to be heading to the stores and online for back to school,” Davis said.
Families also may be feeling a little more confident about the economy, encouraging them to spend a little more, said Jack Kleinhenz, the NRF’s chief economist, on the call.
An increase in the number of shoppers with students going to college, who typically need more big-ticket items than families with younger children, helped boost overall school-related spending even as the amount the average family with college students planned to spend, $888.71, dipped slightly from last year, according to the trade group.
An increase in spending on electronics for younger students could be driving some of the growth in back-to-school spending as college spending stayed relatively flat, Davis said.
“Ten years ago, you saw a lot of college freshmen making big electronics purchases,” she said. “Now you’re seeing it shift to younger grades.”
Shoppers also said they’re planning to start back-to-school shopping earlier this year to spread out their budgets. There was a 10 percent increase in the percentage of families doing back-to-school shopping online, but discount stores are still the most popular choice, followed by department stores and clothing stores, according to the survey.
The survey, conducted for the NRF by Prosper Insights & Analytics, polled 6,809 consumers for a week in late June and early July.
July 21, 2016
Twitter @laurenzumbach
ACE Report: Northeast Ohio job growth paces ahead of state

The increase in the number of people employed in Northeast Ohio between April and May — 4,543 jobs — was greater than the employment growth between April 2015 and April 2016, when the region added 3,780 jobs, as tracked by the Ahola Crain’s Employment (ACE) Report.
The accelerating growth in May, an increase of 0.39% in the regional workforce, might not be a one-month blip.
Jack Kleinhenz, the Cleveland Heights economist who created the ACE Report model, said that it “portends an acceleration in regional economic activity.”
Kleinhenz’s analysis showed that the employment growth came, in raw numbers, more from the service sector than the manufacturing sector, since 80% of the region’s jobs are classified as service.
But on a percentage basis, more were created in the goods-producing sector. The region added 3,538 service jobs, a 0.37% increase, and 1,006 goods-producing, or manufacturing jobs, a 0.47% increase.
Strong growth in new manufacturing orders and modest gains in production and exports, Kleinhenz said, helped account for the growth in goods-producing jobs.
Employment growth in Northeast Ohio, the seven-county Cleveland-Akron area, outperformed on a percentage basis the growth in employment statewide.
In Ohio, nonagricultural employment increased 9,200 in May over April, from 5,477,600 to 5,486,800, a 0.17% increase, according to the Ohio Department of Jobs and Family Services, compared with Northeast Ohio’s 0.39% increase.
The growth in jobs and the declining unemployment rate — metro Cleveland’s unemployment rate is down to 4.8%, while Akron’s is 4.7% — hides a concern among economists about the declining participation of so-called prime-age men — males ages 25 to 54 — in the workforce.
A study released earlier in June by the White House Council of Economic Advisors found that only 88% of the men in that key age group are either working or looking for work. That’s down dramatically from a peak of 98% in 1954.
The study concludes, not surprisingly, that the demand for the labor of lower-skilled men is an important factor in the decline and reflects changing technology and automation and the globalization of the U.S. economy.
This decline in the prime-age male labor force participation rate, the study found, is particularly troubling since workers at this age are at their most productive.
“(B)ecause of this, the long-run decline has outsized implications for individual well-being as well as for broader economic growth,” the study found. “A large body of evidence has linked joblessness to worse economic prospects in the future, lower overall well-being and happiness, and higher mortality, as well as negative consequences for families and communities.”
The economic advisers recommend increasing investment in public infrastructure, creating construction jobs, would help boost prime-age male labor force participation. It also suggests reforming community colleges and other job-training systems.
Seaonally adjusted
| Month | Non-Farm | Small (1-49) | Mid-Sized (50+) | Goods-producing | Service Producing |
|---|---|---|---|---|---|
| Dec (actual) | 1,169,198 | 475,677 | 693,522 | 216,446 | 952,753 |
| Jan (est.) | 1,165,273 | 474,139 | 691,134 | 214,872 | 950,402 |
| Feb (est.) | 1,166,961 | 474,881 | 692,080 | 214,395 | 952,567 |
| Mar (est.) | 1,167,019 | 474,892 | 692,127 | 214,583 | 952,437 |
| Apr (est.) | 1,168,968 | 475,679 | 693,289 | 215,034 | 953,934 |
| May (est.) | 1,173,511 | 477,516 | 695,996 | 216,040 | 957,471 |
| Recent Month’s Estimated Change | |||||
| Apr ’16 to May ’16 | 4,543 | 1,836.96 | 2,706 | 1,006 | 3,538 |
| Diff from May 2015 | 5,946 | 2,617 | 3,329 | (1,736) | 7,682 |
| Trend | |||||
| 3-month | 1,169,833 | 476,029 | 693,804 | 215,219 | 954,614 |
| 6-month | 1,168,489 | 475,464 | 693,025 | 215,228 | 953,260 |
By JAY MILLER
Chief Economist Jack Kleinhenz, Moderator of Opening Panel for NABE and OECD in Paris.
The National Association for Business Economics (NABE) and the Organisation for Economic Cooperation and Development (OECD) co-hosted a global economic symposium at the Paris headquarters of the OECD, May 23-24, 2016.
The goal of the Symposium is to strengthen linkages and networks between leading business economists in the United States and their colleagues across the Atlantic through a dialogue and roundtable that will foster debate and the exchange of frank views on economic issues of mutual concern.
This is the second such symposium to be co-hosted by NABE; the first was conducted May 2015 in Munich, Germany in conjunction with the Deutsche Bundesbank.

John West, Executive Director, Asian Century Institute
Megan Greene, Chief Economist, Manulife and John Hancock Asset Management
Manuel Balmaseda, CBE, Chief Economist, CEMEX
Moderator: Jack Kleinhenz, CBE, Chief Economist, National Retail Federation
ACE Report: April job numbers spring forward

Northeast Ohio gained 1,874 private-sector jobs in April, part of an uptick in the regional labor market that has seen employment grow by an estimated 3,431 jobs over the last 12 months, as tracked by the Ahola Crain’s Employment Report.
Jack Kleinhenz, the Cleveland Heights economist who created the ACE Report model, said the seasonally adjusted employment numbers suggest some optimism about a rebound in manufacturing employment, which has suffered in recent months.
The 0.12% increase in private-sector employment seen in the ACE analysis is comparable to an increase in the April ADP National Employment Report, which saw a modest increase nationally of 156,000 jobs from March to April. However, manufacturing employment declined nationally, according to the ADP report, while Northeast Ohio manufacturing employment in the seven county Cleveland-Akron area grew by 0.36%.
Longer term, according to the ACE analysis, manufacturing employment gained 1,580 jobs since April 2015, a 0.66% gain. Kleinhenz is optimistic that trend will continue.
“Manufacturing has been in a significant swoon that dates back to late 2014,” he said. “However, based on this month’s estimates, manufacturing employment is headed for at least a temporary improvement in the months ahead.”
Both the ACE and ADP data are derived from payroll data of client companies served, nationally by ADP LLC and regionally by The Ahola Corp., a Brecksville payroll and human services firm.
The economists at PNC Financial Services Group Inc., report in their second-quarter Northeast Ohio Market Outlook that manufacturing employment in its Northeast Ohio service area, which includes the Canton and Youngstown metropolitan areas in addition to Cleveland and Akron, would have been stronger had it not been for layoffs in metals production and the energy industry.
Those layoffs were due to competition from steel imports and the sharp decline in energy prices, which has reduced investment in oil and gas drilling in the region.
Looking back to before the recession, however, is a reminder that the region has shed thousands of jobs.
According to data compiled by the Ohio Department of Jobs and Family Services, the Cleveland and Akron metros have lost 62,400 jobs since employment peaked in 2006, before the recession.
The state agency’s data shows that regional employment averaged 1,398,600 during 2006 but has dropped, as of April, to 1,336,200.
Broken down, the Cleveland area has lost 47,000 workers since 2006, while Akron has lost 18,400 jobs.

| Month | Non-Farm | Small (1-49) | Mid-Sized (50+) | Goods-producing | Service Producing |
|---|---|---|---|---|---|
| Sept (Actual) | 1,164,804 | 473,914 | 690,890 | 215,278 | 949,526 |
| Oct (est.) | 1,164,798 | 473,762 | 691,036 | 217,419 | 947,379 |
| Nov (est.) | 1,161,764 | 472,667 | 689,097 | 214,861 | 946,903 |
| Dec (est.) | 1,164,131 | 473,645 | 690,486 | 215,080 | 949,051 |
| Jan (est.) | 1,163,766 | 473,498 | 690,268 | 214,997 | 948,769 |
| Feb (est.) | 1,165,793 | 474,378 | 691,415 | 214,576 | 951,217 |
| Mar (est.) | 1,165,950 | 474,430 | 691,519 | 214,767 | 951,183 |
| Apr (est.) | 1,167,824 | 475,197 | 692,628 | 215,062 | 952,762 |
May 27, 2016
By Jay Miller
Retailers Go Back to the Drawing Board to Draw in Consumers
As consumers alter their buying patterns, developers across the country are blowing up shopping centers and redrawing their mall maps to give more real estate to restaurants, nail salons and gadget stores and less square footage to clothing outposts.
Increased competition from online e-commerce sites has forced developers to retool their shopping emporiums to be more in step with the times and grab some of the 3.1 percent growth in retail sales predicted for 2016.
Even though e-commerce represents only 13 percent to 14 percent of retail sales, it continues to march along at a very fast pace. “Over the last 15 years, e-commerce has taken 30 percent of the growth in sales,” said David Shulman, senior economist with the UCLA Anderson Forecast. “But people still want to be out, be seen and touch things. Malls are out to sell an experience, which is why you are seeing more restaurants and other things at malls.”
The fast pace of commercial redevelopment is front and center in Los Angeles, where major malls such as the Westfield Century City, the Beverly Center and the Westside Pavilion have announced billion-dollar plans to retool their shopping centers and open them up to create more of a Main Street experience.
Westfield Inc.’s $800 million makeover of its Century City mall includes the first West Coast branch of Eataly, an Italian food emporium co-owned by celebrity chef Mario Batali; a new Nordstrom; an upgraded Bloomingdale’s; a new Macy’s building; and more open-plaza areas. About one-quarter of the high-end shopping center will be devoted to eateries.
Using the same retail model, the Beverly Center in March announced it was undertaking a $500 million remodel of its decades-old mall that will add more restaurants and open up the structure with skylights.
Retail sales have been tough this year—particularly for department stores, which saw flat sales in February compared to the previous year.
Macy’s same-store sales fell by 3 percent in 2015. Kohl’s reported same-store sales growth of only 0.7 percent for the same year.
“People still remain somewhat cautious,” said Jack Kleinhenz, the chief economist for the National Retail Federation. “While it was a while ago since the Great Recession took place, people have adjusted their purchasing habits.”
Shoppers today are buying more building materials and furniture to spiff up their houses or get them ready to sell than purchasing clothing. “Building materials and garden supplies were way up in February because of good weather and people investing in their homes,” Kleinhenz said.
Sporting goods sales were also doing well, up 6.5 percent in February over the previous year. “More people are wearing leisure apparel and buying more of that at a sporting-goods store than a department store. Leisure apparel has been very strong in the last year and a half,” Kleinhenz noted.
With so much inventory floating around, department stores and retail chains seem to be holding a sale every two weeks or introducing special 20 percent off discount coupons to lure buyers in. “Fifty-five percent of the people I interview said they are delaying their purchases compared to 28 percent last year,” said Britt Beemer, a retail analyst and founder of America’s Research Group, which polls 1,200 consumers a week to take the pulse of their retail-spending attitude. “Consumers are going out and gobbling up all those bargains and then hibernating.”
Consumer confidence in the country is all over the map—varying by region. States such as Texas, Louisiana and Oklahoma as well as California’s Central Valley, which are reliant on the oil industry, are seeing consumers pull in their credit cards.
The Midwest is looking very solid as strong crop prices have helped boost take-home pay.
In California, shoppers still were sitting on the fence. A recent survey by the A. Gary Anderson Center for Economic Research at Chapman University in Orange, Calif., showed that during the first quarter of this year, consumers were losing some of their optimism. Despite a relatively strong job market, things such as stock-market corrections, low housing affordability and higher rents negatively affected consumers’ attitudes.
Beemer noted that consumers were tired of treading water. “They are not better off, and they are getting tired of it,” he said.
Slow sales
Figures recently released by the U.S. Department of Commerce show March retail sales were up 0.1 percent from February if you took out sales of cars, building materials and gasoline. While that isn’t spectacular, it is movement forward.
“The economy keeps plugging away. It is not at a great growth rate, but we will take it,” said Robert Kleinhenz, executive director of research at Beacon Economics in Los Angeles. (He is the brother of Jack Kleinhenz.)
Job growth continues at a faster pace in California than in the rest of the country. The state’s employment roles in February increased 2.8 percent over the previous year while the rest of the nation’s job market was up 2 percent during the same period. Employers are expected to add to their payrolls for the rest of this year.
With rising jobs come rising real estate prices in Southern California. Overall average asking lease rates for retail in the Greater Los Angeles market grew by 6 cents during the first quarter of 2016, ending at $2.37 per square foot, according to CBRE Research. That is up 21 cents from the same period last year, with rates expected to continue growing through 2017.
Retail vacancies in the Greater Los Angeles area were at 5.3 percent in the first quarter of this year—almost the same as last year.
In February, housing prices in Los Angeles County were up 6.1 percent over the previous year, with the median price reaching $445,000, below the $550,000 peak seen in late 2006 and early 2007.
In Orange County, the median house price in February soared to $712,000, nudging up against the all-time high of $720,000, Robert Kleinhenz said.
New housing permits in California are on the upswing. In 2015, there were about 97,000 new housing permits issued in the state for single- and multi-family residences. This year, it is expected to reach 110,000. The long-run average is for 125,000 permits a year.
“The wild card is demographics,” Robert Kleinhenz said. “The older half of the millennials [born between the early 1980s to the early 2000s] should be—at this point—forming households—be they renters or homeowners,” he said. “That decision has been delayed by virtue of the recession and the long shadow it has cast. Somewhere along the line, the millennials will start showing up in the housing market.”
By Deborah Belgum | Thursday, April 14, 2016 California Apparel News
ACE Report: Northeast Ohio posts another modest jobs gain
The Northeast Ohio workforce gained 682 paychecks in February. A small number, but in a jobs picture on a roller coaster, any gain is better than the alternative.
The latest Ahola Crain’s Employment (ACE) Report projects that private-sector employment in the Cleveland-Akron metropolitan region’s private sector grew to 1,164,001 jobs in February from 1,163,319 in January on a seasonally adjusted basis, an increase of 0.06%.
The economy of the seven-county metro area seems to be settling into a new normal of year-to-year slow job growth with month-to-month ups and downs, even when seasonal fluctuations are smoothed out. Over the last 12 months, employment is up 1,433 jobs, a slight 0.12% gain since February 2015, when the region employed 1,162,568 people.
Employment peaked in July at 1,167,490, then slid for four months to 1,161,984 before recovering.
“The estimated job growth indicates a modest pace of business activity,” reports economist Jack Kleinhenz, who devised the ACE model. “The world economies were not well behaved in the early months of 2016, impacting the outlook for the U.S. and probably creating some drag on the regional economy.”
The metro area growth lags slightly the growth in state employment.
According to the Ohio Department of Jobs and Family Services, employment statewide grew by 53,000 jobs, a 0.98% gain from 5,344,000 in February 2015 to 5,397,000 in February 2016.
Manufacturing has been sluggish, stemming from slower growth overseas and the stronger U.S. dollar, Kleinhenz said, though he believes that gains in consumer spending, income, employment and housing prices will counter the manufacturing slowdown.
“Consumer spending is off on a strong start this year,” said Kleinhenz, who is the chief economist for the National Retail Federation, a major retail trade association. “Housing should get the benefit of a better labor market and growing incomes. The early Easter should also pull spending into the first quarter.”
The Federal Reserve Board’s March Beige Book, the Fed’s eight-times-a-year assessment of economic conditions across the country, concurs with the ACE characterization. It lumps its Cleveland-based Fourth District — which includes Ohio, Western Pennsylvania and Eastern Kentucky — among the majority of the Fed’s 12 districts that are reporting “modest” growth in the labor market.
The Fed noted reports from the Fourth District that low-skilled jobs were becoming increasingly difficult to fill.
The ACE Report is based on payroll data from about 3,000 predominantly small and midsize employers that is gathered by The Ahola Corp., a Brecksville payroll and human capital management firm and on other economic indicators, including construction data and retail sales.

| Month | Non-Farm | Small (1-49) | Mid-Sized (50+) | Goods-producing | Service Producing |
|---|---|---|---|---|---|
| September(Actual) | 1,164,804 | 473,914 | 690,890 | 215,278 | 949,526 |
| Oct(est) | 1,163,125 | 473,123 | 690,002 | 216,507 | 946,618 |
| Nov(est.) | 1,161,984 | 472,760 | 689,224 | 214,844 | 947,140 |
| Dec(est) | 1,164,239 | 473,693 | 690,546 | 215,039 | 949,201 |
| Jan(est) | 1,163,319 | 473,318 | 690,000 | 214,876 | 948,443 |
| Feb(est) | 1,164,001 | 473,686 | 690,314 | 213,703 | 950,298 |
| Recent Month’s Estimated Change | |||||
| Jan ’16 to Feb ’16 | 682 | 367.95 | 314 | (1,172) | 1,854 |
| Diff from Feb 2015 | 1,433 | 888 | 544 | (4,114) | 5,547 |
| Trend | |||||
| 3-month | 1,163,853 | 473,566 | 690,287 | 214,539 | 949,314 |
| 6-month | 1,163,579 | 473,416 | 690,163 | 215,041 | 948,538 |
By JAY MILLER
March 25, 2016